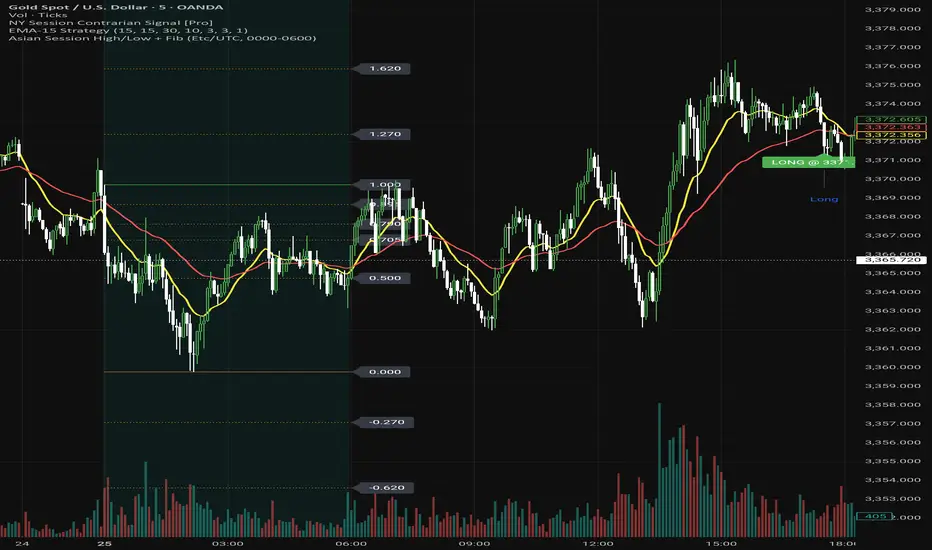
Asian Session High/Low + FibThis is a indicator for only Asian season plus FIB it works only Asian season so you apply and enjoy indicator
Поиск скриптов по запросу "session high"
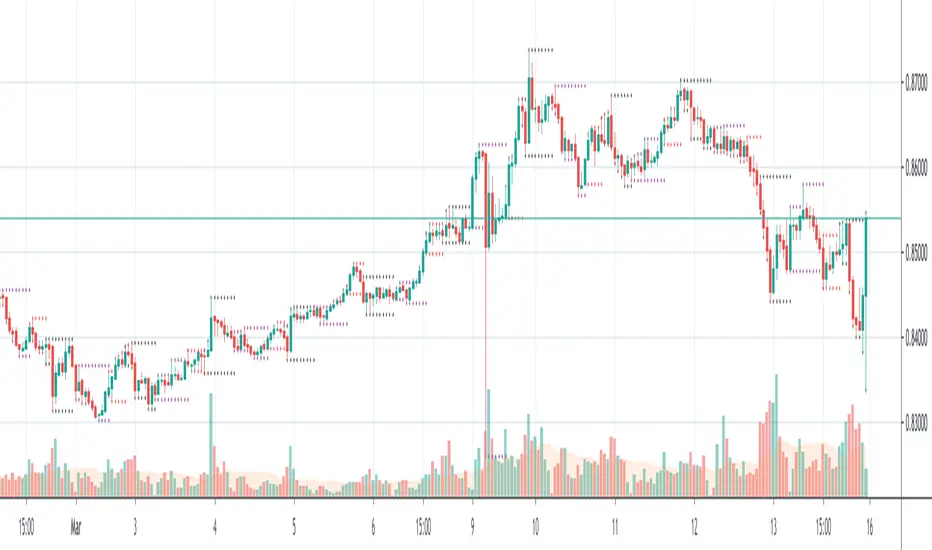
Customisable Asia & London Session High/Low (UTC+1)london + asia high / low
can customise however you like. its not perfect but saves time
Z-Score Multi-Model ClusteringA price/volume clustering framework combining three market behavior models into a single indicator. Designed to help identify emerging trend strength, turning points, and volatility-driven entries or exits.
🔍 How It Works
This indicator classifies market states by comparing normalized price/volume behavior (via Z-Score) to different types of statistical or geometric "cluster centers." You can choose from three clustering approaches:
🧠 Clustering Models
1. Percentile (Z+CVD) – Trend Momentum Bias
Uses volume Z-Score + Cumulative Volume Delta (CVD).
Detects institutional pressure by clustering volume surges with directional delta.
Best for: Breakouts, momentum trades, volume-led reversals.
Cluster Colors:
🔹 Green triangle = Strong bullish confluence
🔻 Red triangle = Bearish divergence (bull trap risk)
⚪ Gray = Neutral/low conviction
2. Euclidean (Z+Slope) – Swing Mean-Reversion
Measures the angle of recent Z-score slope and compares it to directional cluster centers.
Helps detect early directional shifts or exhaustion.
Best for: Swing entries, pullback setups, exit timing
3. Hilbert Phase – Turn Detection via Signal Phase
Applies Hilbert Transform to the Z-Score, measuring the phase difference between trend and oscillator components.
Ideal for anticipating turns or detecting cyclical inflection points.
Useful for: Scalping, top/bottom spotting, volatility fades
✅ Features
Auto-updating cluster logic based on current data
Tooltips and clean user interface
Optional cluster bar coloring (can be toggled off)
Signal-only plotting keeps candlesticks readable
Clear entry/exit logic with triangle markers
Supports trend, swing, and oscillation-based systems
🛠️ Suggested Use Cases
Combine with VWAP, Session High/Low, or Liquidity Zones to confirm entry conditions.
Use Cluster 2 (strong bullish) on pullbacks to trend structure for add-on entries.
Use Cluster 1 in strong trends to watch for potential traps or exits.
Toggle models based on your strategy: e.g., Hilbert for scalping, Percentile for macro trend breaks.
🧪 Best Timeframes
Works across all markets and timeframes
For Percentile (Z+CVD), use intraday TF with 1m–5m CVD source
Hilbert and Euclidean preferred on 5m–1h for accurate slope/phase signals
⚠️ Notes
Clusters do not generate trade signals alone; use them in context with structure, VWAP, or trend filters.
Marker signals are filtered with a magnitude threshold to reduce noise.

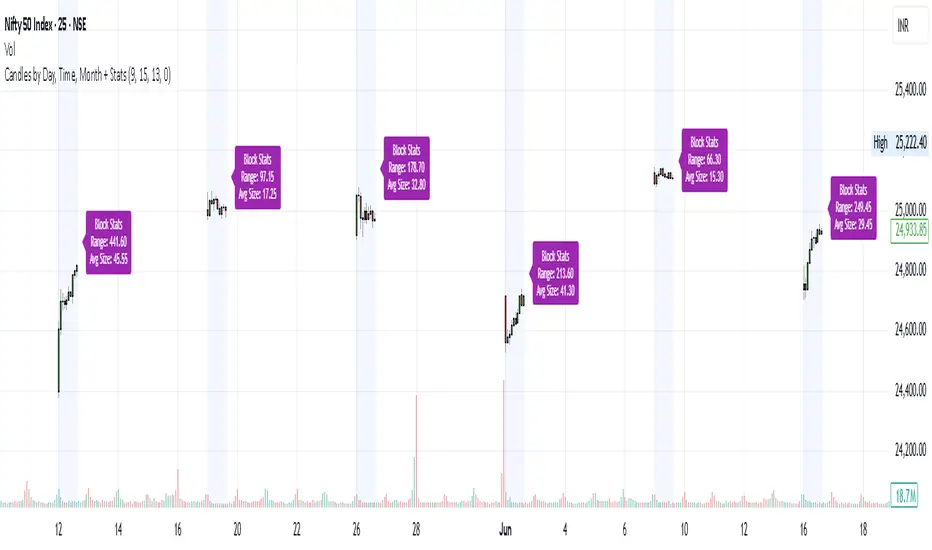
Candles by Day, Time, Month + StatsThis Pine Script allows you to filter and display candles based on:
📅 Specific days of the week
🕒 Custom intraday time ranges (e.g., 9:15 to 10:30)
📆 Selected months
📊 Shows stats for each filtered block:
🔼 Range (High – Low)
📏 Average candle body size
⚙️ Key Features:
✅ Filter by day, time, and month
🎛 Toggle to show/hide the stats label
🟩 Candles are drawn only for selected conditions
📍 Stats label is positioned above session high (adjustable)
⚠️ Important Setup Instructions:
✅ 1. Use it on a blank chart
To avoid overlaying with default candles:
Open the chart of your preferred symbol
Click on the chart type (top toolbar: "Candles", "Bars", etc.)
Select "Blank" from the dropdown (this will hide all native candles)
Apply this indicator
This ensures only the filtered candles from the script are visible.
Adjust for your local timezone
This script uses a hardcoded timezone: "Asia/Kolkata"
If you are in a different timezone, change it to your own (e.g. "America/New_York", "Europe/London", etc.) in all instances of:
time(timeframe.period, "Asia/Kolkata")
timestamp("Asia/Kolkata", ...)
Use Cases:
Opening range behavior on specific weekdays/months
Detecting market anomalies during exact windows
Building visual logs of preferred trade hours
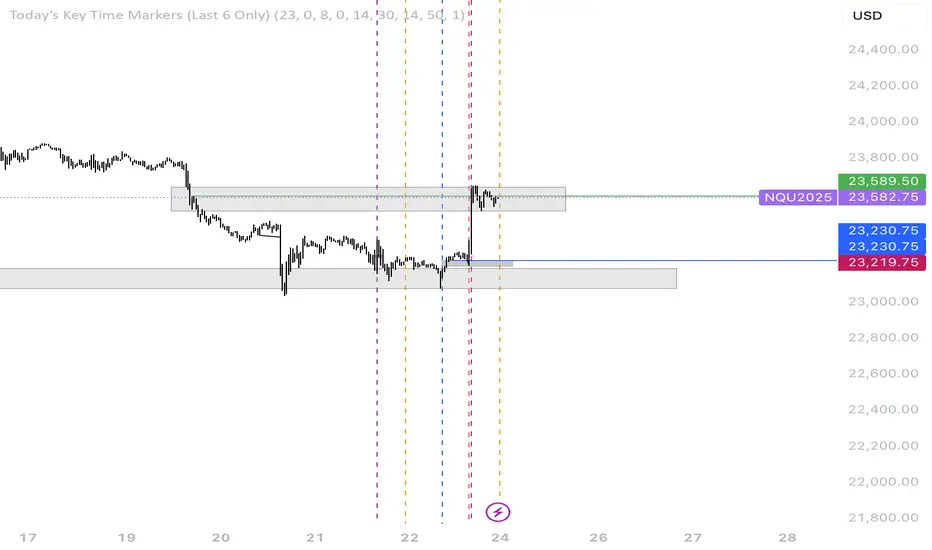
QT NY Session High/LowShows Asia & London High/Low which are key liquidity points price will react to.
You can also adjust the NY AM 6am - 12pm EST range to divide the time frames into 4 quarters
It delivers NY AM true open and the true day open
It gives you previous day high & previous day low

Multiple Timeframe LevelsThe multiple timeframe levels indicator plots the following lines on your chart:
Previous day's high, low, and midpoint
Previous week's high, low, and midpoint
Previous month's high, low, and midpoint
Overnight session high, low, and midpoint
This indicator makes it easy to plot the high timeframe levels on your chart so that you can focus on your preferred timeframe for trading. This can be used however you see fit. These levels are great for finding support and resistance, setting your stop losses and take profits, looking for reversals, etc.
You can customize this script my enabling/disabling the timeframe's high/low or midpoint as well as the color.

London Killzone + Deviations[MK]For traders that use the London Killzone session high/low to project possible take profit targets.
The indicator will determine the current day London killzone high and low range and draw a range box to the right of the last candle on the chart. Drawing to the right of the chart keeps the workspace cleaner.
The high/low range is then used to project Standard Deviation levels above and below the London range.
Levels projected are +/- 1, 2, 2.5, 3, 4.
Users of the script should conduct proper backtesting using a large data range before applying to live accounts.

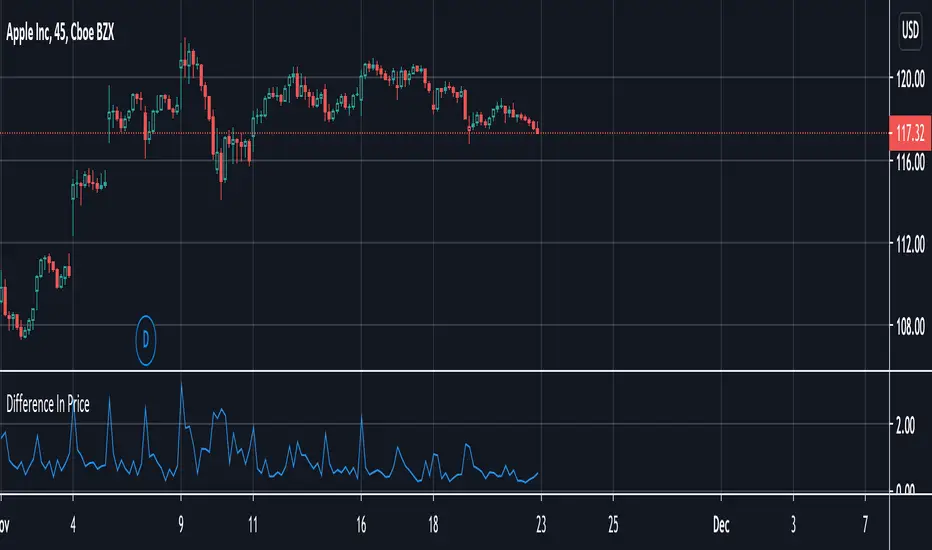
Difference In PriceWith the difference in price indicator, you can view price change volatility. Specifically, you can view the difference in price for a single candle segment, at any desired candlestick timeframe. This simply takes the sessions high minus the low and gives the difference. Difference in price trend lines help determine if a stock has a history of high volatility or not. This is useful for those looking to invest in stable stocks.
YHLC INDICATORTAKING THE PREVIOUS SESSION HIGH LOW AND CLOSE PROJECTING IT TO CURRENT SESSION.
50%, 100% EXPANSION TARGETS ON BOTH SIDES.

Trading Sessions by Aflaq for UF TradersThis indicator is meant for traders under the UF Program who needs a quick way to show multiple sessions high and low
Reference ProfileMarks the session high, low, and midpoint as well as the the open/close of the session
